What is BIM?
From Bimstop.com
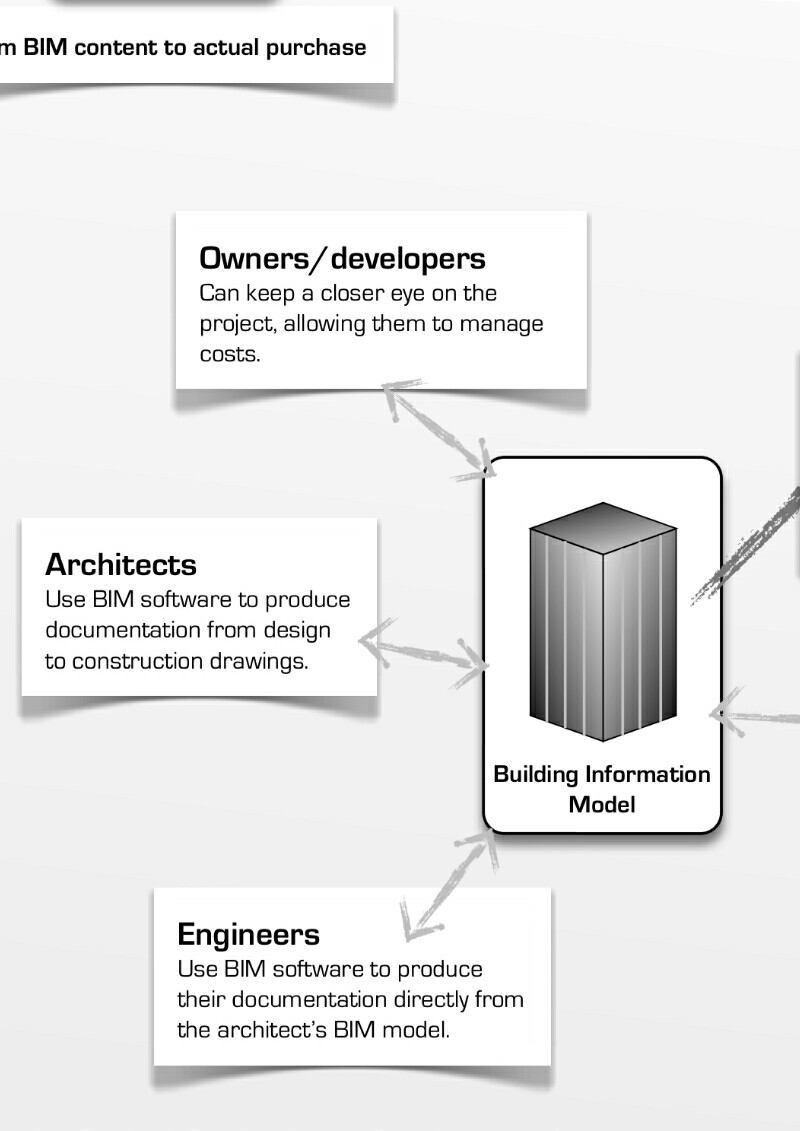
This is a brief flowchart indicating how BIM is implemented in the product market. An area that could help drive BIM usage in the firms purchasing these products.
To view full image please download from link provided above.

BIM Survey 2012
From NBS.com
A comparison of the usage and awareness of BIM over the past few years. Using beautifully clean graphs it really exemplifies the need for information among the AEC industry.

BIM: Breaking down the barriers
From Aconex.com
A visually appealing vertical infographic that touches on: The definition, Three year growth, Benefits, Challenges, and Five useful Tips. This doesn't cover everything, but it is a solid overview to anyone new to the concept.

Prevent your extinction
From Lineshapespace.com
A fun, dinosaur based graphic that makes a wonderful case for adopting BIM by addressing some major concerns that prevent many from moving forward. Presented by Autodesk.
Click here to view full image
If you liked this please share it with your friends and colleagues so we can get this discussion moving. Have a great weekend!
Monday:
Building Information Modeling: Collaboration in Design
Wednesday:
The Route to BIM in 10 Steps
Augmented Reality (AR) could Revolutionize BIM
Written and Curated by:
Ian Salamanca
Editor-in-chief
From my personal experience the best construction project management software is Procore, I use this for all my projects and never face any kind of issues.
ReplyDelete